The Analyst - WinStock Software
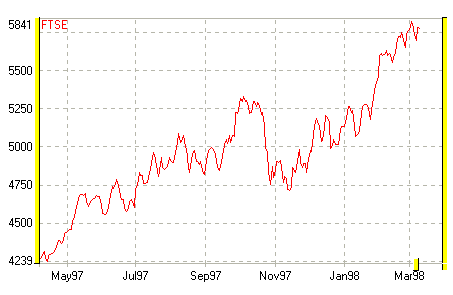
WinStock's powerful charting facilities allow you to view and analyse the price history of any share. Examine trends, draw moving averages or overlay other shares for an instant comparison.
You may display any number of charts together on the screen and arrange them in a way to suit yourself. Use logarithmic, high-low or candlestick displays and save your work at the touch of a button.
Zooming in and out is controlled by sliding pointers on the graphs themselves, giving you very precise control. Change colours and fonts, delete objects and move lines freely, simply by clicking on the chart.
WinStock lets you save your analysis techniques as templates ready to apply to any other security, and will save your screen layout at the end of a session.
Chart Types |
Logarithmic and linear |
| Line and bar charts | |
| Japanese candlestick displays | |
Chart Functions |
Load any number of charts in any arrangement |
| Change colours, styles, fonts; move lines with ease | |
| Click on a chart for instant price and change readouts | |
| Selective clear of lines and curves | |
| Page through graphs | |
| Save graphs, analysis and templates | |
| Zoom in and out controlled from the chart | |
| Print charts |

Share price data can be analysed using a variety of techniques such as overbought/oversold, momentum, RSI and so on. Analysis charts are grouped with the main price chart and all group members resize and rescale together. You can use one analysis chart to hold a number of analysis types, or several analysis charts to display different parameters.
Moving averages, stop-loss, regression and freeform lines are available on all charts.
Analysis Overlays (unlimited) |
Moving average (simple, exponential, centred, lagged) |
| Bollinger bands | |
| Stop-loss (long/short) | |
| Comparisons overlays | |
| Regression and Freeform trend lines | |
| Confidence bands and rate of change displays | |
Analysis Indicators |
Relative strength (RSI) |
| Moving average convergence/divergence (MACD) | |
| Stochastic | |
| Over bought/over sold (OBOS) | |
| Momentum - price rate of change, meisels | |
| Fibonacci fan lines |
"The Analyst" will rank shares by percentage price change over any period. Use graphing or imaging techniques to study the winners.
Price ImagingThe Price Imaging module gives you an alternative method of displaying share price histories. By showing price movement as colour (blue for up; red for down), WinStock gives you an overview of market trends.
Using Price Imaging you may, for example, display six months of share price movements for all shares in a sector, in a single window. Scroll through the image and see trends at a glance. Click on any company to see its price chart.
Price Alarms"The Analyst" monitors any number of high or low price alarms. When an alarm is crossed, the program sounds a warning and writes to the alarm report.
| phone (44) (0)7925 979484 | email winstocksoftware@lineone.net |